Export Streamlit data to a PDF report
Turn a filtered data view into a report someone can read, print, or share. This Streamlit app accepts a small sales CSV, filters dates and groups, and generates a PDF with summary figures, revenue bars, and the selected records. Fullbleed runs in Streamlit's Python server; HTML/CSS controls the print design.
Download the complete app Open the sample PDF
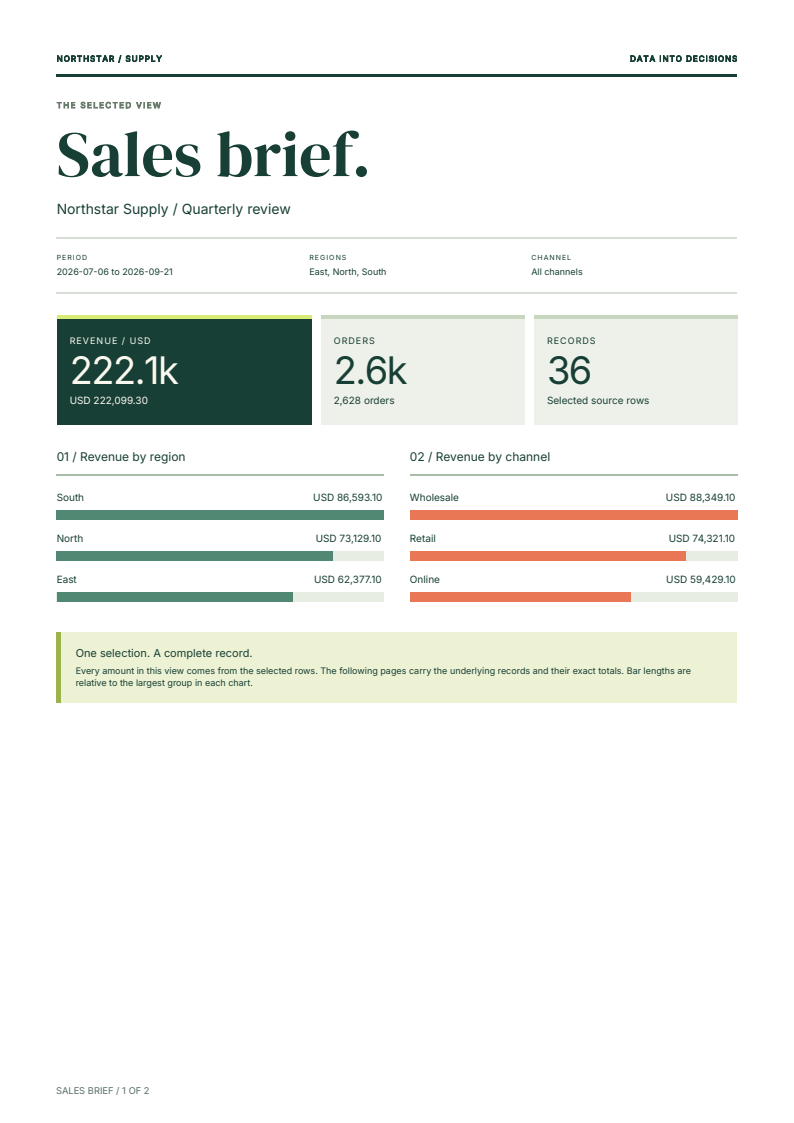
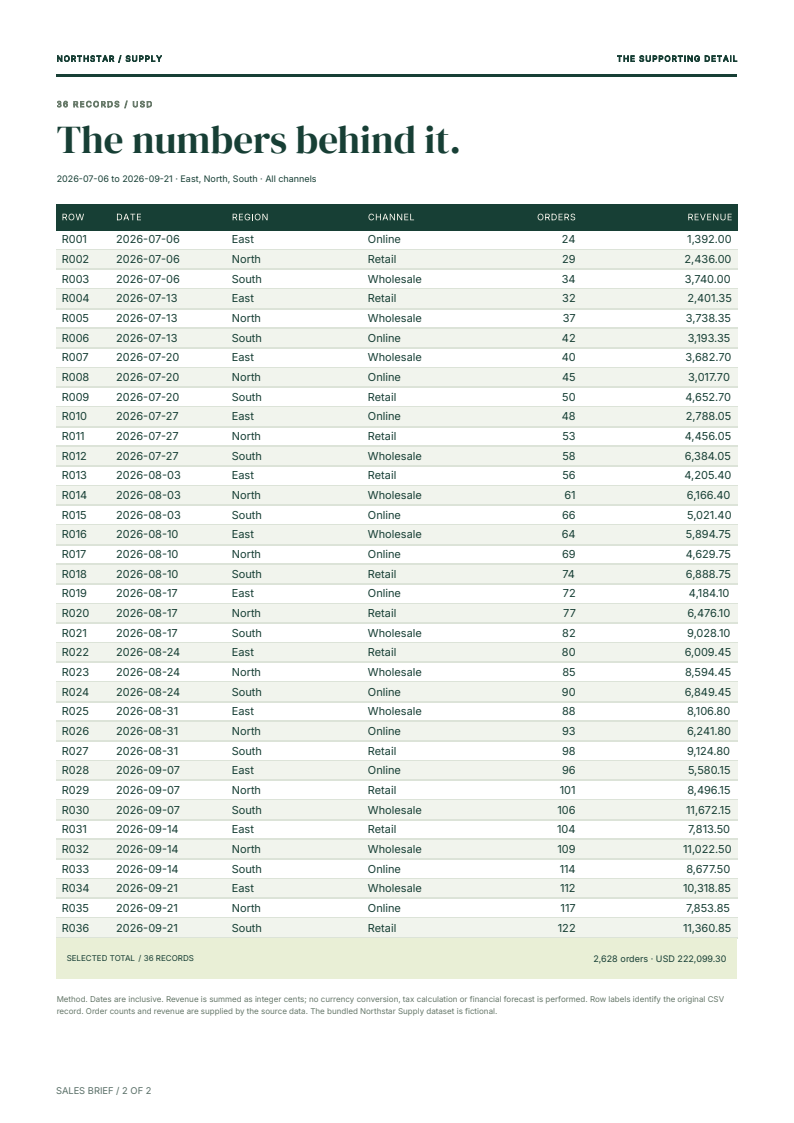
The fictional Northstar Supply sample contains 36 records, 2,628 orders and USD 222,099.30. Its two-page PDF includes every source row and exact totals. Preview the ledger or inspect the source and download hashes.
Run the app
Use Python 3.11. Extract the ZIP, open fullbleed-streamlit-report, and create
a virtual environment:
Activate it with source .venv/bin/activate on macOS/Linux or
.venv\Scripts\Activate.ps1 in Windows PowerShell. Then run:
Open http://127.0.0.1:8501. The requirements pin Fullbleed 2.5.23,
Streamlit 1.65.0, and the first-party Streamlit PDF viewer 2.1.0.
The app needs no system-font setup or separate rendering service.
- Choose dates, regions and a channel in the sidebar, or upload a CSV.
- Select Prepare PDF.
- Check the prepared selection and scroll through the PDF viewer.
- Select Download prepared PDF to save
sales-brief.pdf.
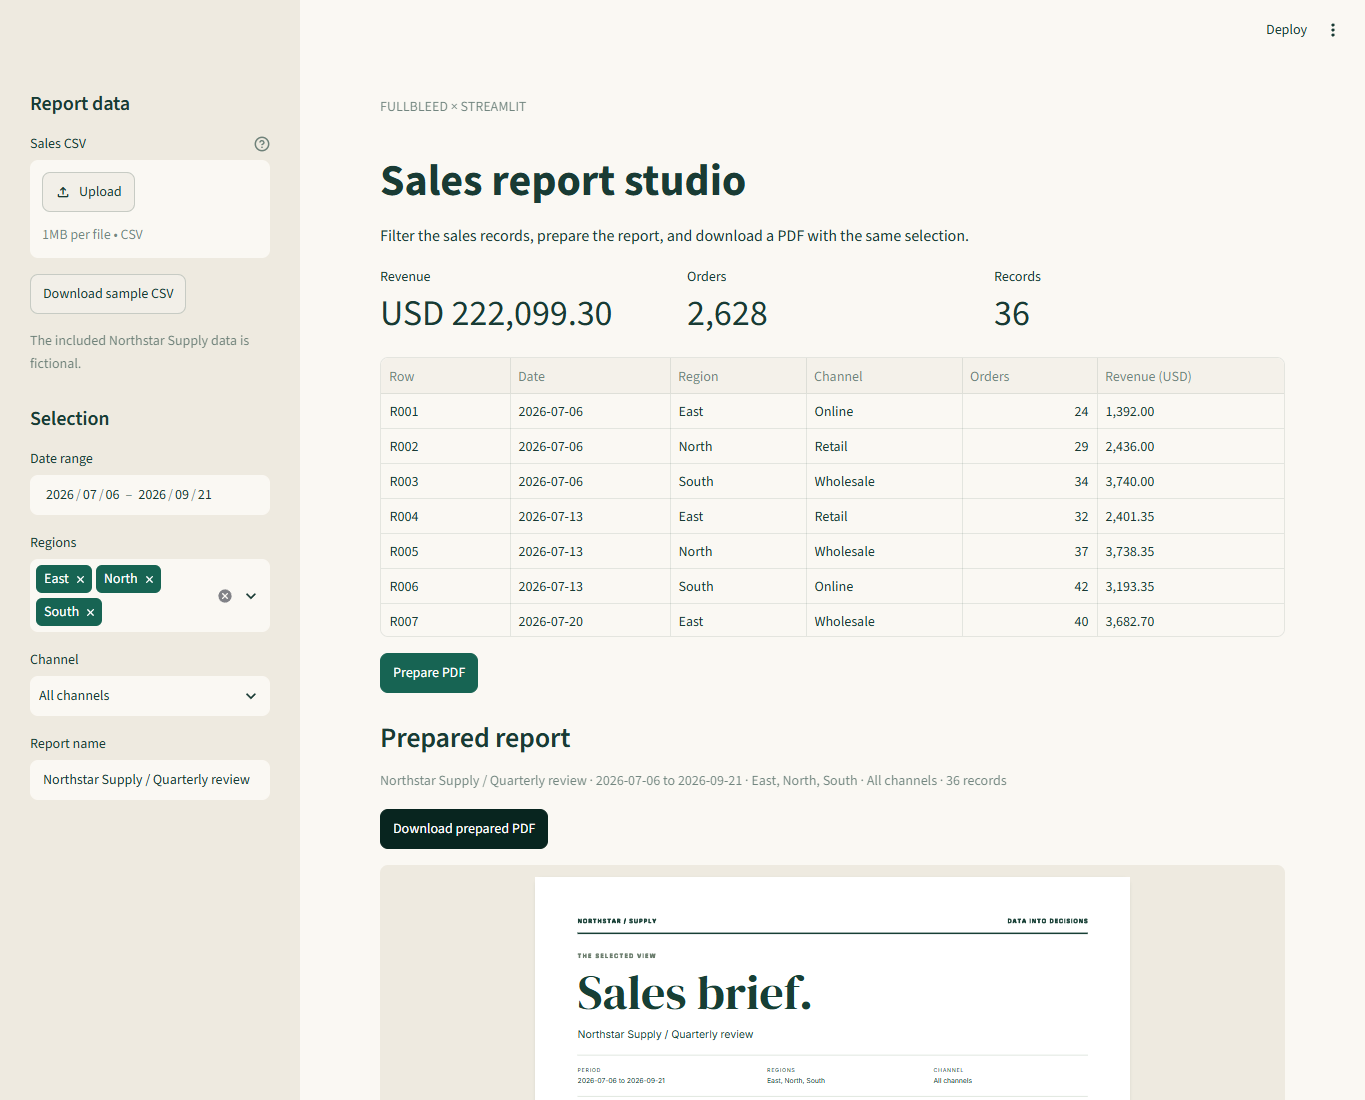
The PDF viewer displays the same bytes as the download. Its scrolling and zoom controls preserve the prepared report. Changing a committed input clears the download; select Prepare PDF again for the new selection. A new CSV starts with its own complete date range and group choices.
Add a PDF download to your Streamlit code
After preparing the PDF, pass its bytes directly to the download widget:
st.download_button(
    "Download prepared PDF",
    data=prepared["pdf"],
    file_name="sales-brief.pdf",
    mime="application/pdf",
    on_click="ignore",
)
st.pdf(prepared["pdf"], height=720, alt="Sales report for the prepared selection")
on_click="ignore" prevents the download button itself from rerunning the app.
Finish editing fields before preparing a report: another input with a pending
change can still trigger a rerun. The prepared-selection caption identifies
the snapshot being downloaded. See Streamlit's
download-button behavior
and PDF viewer.
The complete app stores prepared bytes in
st.session_state.
A fingerprint of the expanded HTML and CSS detects a changed document, and
input callbacks clear the previous result. Prepared reports are not stored in
a shared application cache. A browser reload or disconnection can reset the session.
Supply your own records
Download the sample CSV from the sidebar to start with the correct columns:
Dates use YYYY-MM-DD; the selected range includes both endpoints. Order counts
are nonnegative integers, and revenue is a nonnegative USD decimal with at most
two decimal places. The app sums integer cents, displays exact amounts beneath
abbreviated headline figures, and repeats the exact total after the ledger.
The example accepts up to 250 records, 64 KiB, six regions and six channels. Names have at most 24 characters after trimming. Each record allows up to 100,000 orders and USD 1,000,000 in revenue; the prepared PDF is capped at 8 MiB. Invalid data displays an error and clears the old download. No-match selections also leave the download unavailable. The app does not calculate tax, convert currencies, or deduplicate records.
Rows are sorted by date, region and channel. Labels such as R015 identify the
original CSV record after filtering, so a PDF row can be traced back to its input.
Make the report your own
Edit report.html for structure and report.css for print styling, then prepare
the PDF again. The example uses explicit fonts, a separate summary page, grid
panels, CSS bars, striped ledger rows and repeated table headers. Longer ledgers
continue onto additional pages. Streamlit's interface styles do not determine
the printed layout.
The template uses Python string.Template placeholders such as $name, $rows
and $revenue. Use $$ for a literal dollar sign. Text is escaped before
substitution, including labels that resemble HTML or template syntax.
Inter comes from the Fullbleed wheel. The ZIP includes DM Serif Display and its
SIL Open Font License. Register another suitable font in render_report when
your data needs characters these fonts do not cover. Missing glyphs stop report
preparation instead of silently offering a damaged document.
To render the complete dataset without opening Streamlit:
Open output/report.pdf; output/report.html contains the expanded markup.
Pass --csv your-data.csv to use another complete dataset. The same report.py
functions can be called from an existing application.
What is checked
The verification record covers the actual extracted ZIP. Independent PDF readers check the sample, date/channel filters, literal markup, zero values and a 250-record ledger. They inspect every row, exact totals, page geometry and selectable text. Repeated renders must produce identical PDF bytes for these fixtures.
Real browser checks exercise preparation, download headers and bytes, changed inputs, date controls, two separate sessions, invalid-upload recovery and a 390-pixel viewport. The PDF viewer is checked on its second page, including the repeated masthead. These are finite example checks, not production-capacity or PDF standards-conformance claims.
The starter runs locally by default. A hosted Streamlit app receives uploaded data on its server. Add your application's access, capacity and retention controls before connecting private records. The app keeps prepared PDFs in its session memory and does not write generated reports to disk; the explicit CLI command above writes to the requested output directory.