Put Matplotlib charts in a styled PDF report
Use Matplotlib to draw the figures and Fullbleed to compose the report around them: headings, commentary, tables, explicit fonts and page numbers. This example generates a two-page operations brief from local JSON with Fullbleed 2.5.14 and Matplotlib 3.11.2. All names and data are fictional.
Download the report project Open the two-page PDF
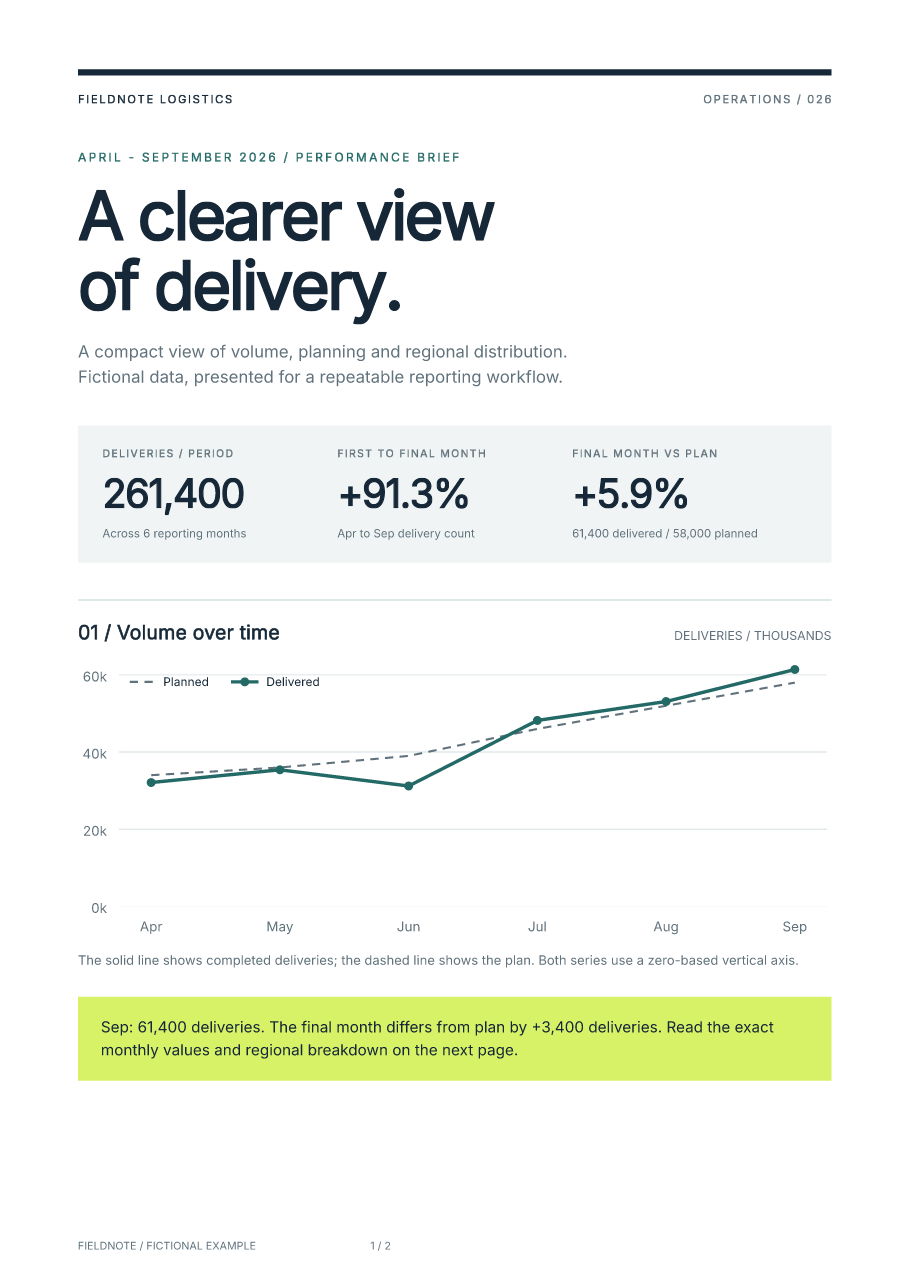
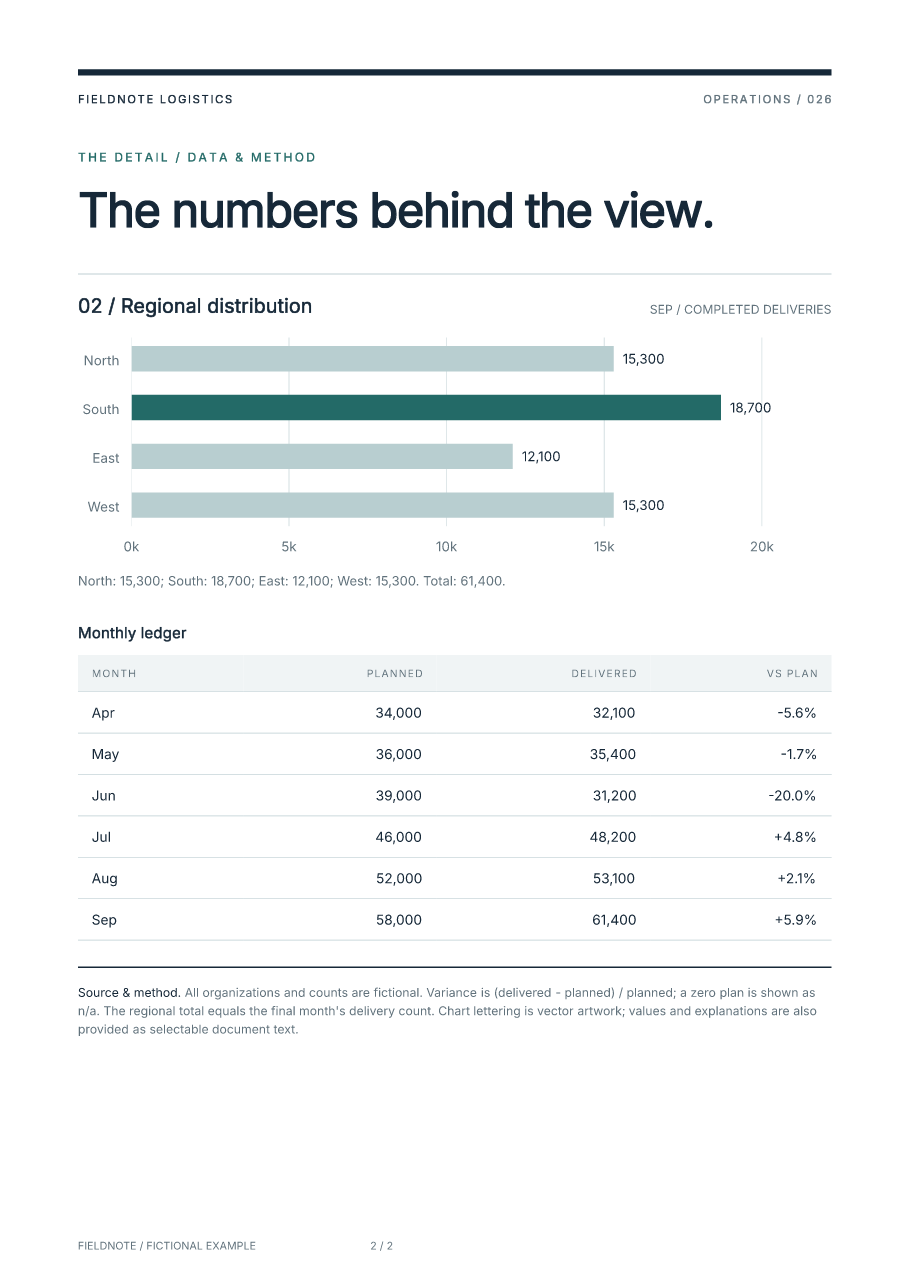
Preview page 2 · Verification results · Browse the source
If you only need a chart PDF, Matplotlib's own
savefig()
or PdfPages
can export figures directly. The workflow below adds an HTML/CSS document around
those figures.
Run the complete example
Use Python 3.11 or newer. Extract the ZIP, open a terminal in matplotlib-report,
and create a virtual environment:
Activate it with .venv\Scripts\activate on Windows or
source .venv/bin/activate on macOS/Linux. Then:
Open output/report.pdf. The output/preview/ directory contains the rendered
pages. The example also retains its HTML, two SVG figures, Matplotlib reference
PNGs and a JSON report of versions, totals and hashes. The PNGs help review the
figures; they are not embedded in the PDF.
Matplotlib is an optional dependency of this project. It is not added to Fullbleed's base installation. Both renderers use Inter from the Fullbleed wheel, so the example does not depend on system fonts, a browser or a TeX installation.
Export a figure as SVG and register it
This smaller example runs with the same installed requirements. Save it as
chart_pdf.py, then run python chart_pdf.py:
from importlib.resources import files
from pathlib import Path

import fullbleed
import matplotlib
matplotlib.use("Agg")
from matplotlib.figure import Figure
from matplotlib.font_manager import FontProperties
from matplotlib.text import Text

font = files("fullbleed_assets").joinpath("fonts/Inter-Variable.ttf")
fig = Figure(figsize=(7, 3), layout="constrained")
ax = fig.subplots()
ax.plot(["Apr", "May", "Jun"], [32, 35, 41], marker="o", color="#236a67")
ax.set(ylabel="Deliveries (thousands)", ylim=(0, 50))
for label in fig.findobj(Text):
    label.set_fontproperties(FontProperties(fname=str(font), size=10))
    label.set_parse_math(False)
    label.set_usetex(False)

with matplotlib.rc_context({"svg.fonttype": "path", "svg.hashsalt": "my-report"}):
    with open("chart.svg", "w", encoding="utf-8", newline="\n") as svg:
        fig.savefig(svg, format="svg", metadata={"Date": None})
fig.clear()

bundle = fullbleed.AssetBundle()
bundle.add_file(str(Path("chart.svg").resolve()), "svg", name="chart.svg")
engine = fullbleed.PdfEngine(
    font_files=[str(font)], svg_form_xobjects=True, svg_raster_fallback=False,
)
engine.register_bundle(bundle)
html = """<html lang="en"><body><h1>Delivery report</h1>
<img src="chart.svg" alt="April: 32,000; May: 35,000; June: 41,000 deliveries.">
<p>April: 32,000; May: 35,000; June: 41,000 deliveries.</p></body></html>"""
css = """@page { size: A4; margin: 18mm; }
body { font-family: Inter; color: #162838; }
img { display: block; width: 174mm; height: 74.57mm; }"""
engine.render_pdf_to_file(html, css, "chart-report.pdf")
AssetBundle registers the local SVG under the name used by <img>. Preserve
the figure's aspect ratio when sizing it in CSS; a 7-by-3-inch figure here maps
to 174 by 74.57 mm. The complete example keeps plotting code and the report
stylesheet separate so each can be edited independently.
Keep chart shapes portable and values selectable
Matplotlib's svg.fonttype
setting controls chart text export. With "path", letters become vector shapes.
This preserves the supplied font's appearance without requiring the SVG consumer
to discover that font, but the chart labels themselves are not searchable PDF
text. Repeat the values and descriptions in HTML tables or captions, as the
sample does. An image alt attribute and a data table alone do not establish
PDF accessibility conformance; see the tagged-PDF workflow.
The two supplied charts remain vector paths in the PDF. The retained checks
inspect the PDF objects for paths and confirm that there are no raster images.
Other figures need their own review: imshow(), image artists and explicitly
rasterized artists can put raster content inside an SVG. See Matplotlib's
rasterization explanation.
Setting svg.hashsalt and omitting the export date remove two sources of
changing SVG bytes. Explicit LF line endings also keep the text file consistent
between Windows and Linux. The project pins its dependencies, uses an explicit font
file and verifies repeated SVG/PDF hashes. Updating Matplotlib, FreeType, fonts
or the renderer can still change geometry or bytes; review new output before
replacing a baseline.
Use your own data and design
Edit data.json, or supply another file:
Each monthly record has a label, planned and delivered count. Regional
records have a label and delivered count; their total must equal the final
month's delivered count. Counts are nonnegative integers. Duplicate labels,
negative counts and inconsistent totals fail before rendering. A zero plan
shows n/a for its percentage comparison.
Change report.css for page design and charts() in report.py for plotting.
Change document() for document structure and wording. Text from JSON is escaped
before entering HTML. Review the resulting pages when changing labels, fonts
or record counts; the published two-page specimen uses six months and four regions.
For data preparation, start with the pandas report guide. For repeatable automated runs, use the Docker example or PDF regression checks in CI.