Export a pandas DataFrame to PDF
Use pandas to prepare your data, DataFrame.to_html() to create the table, and
Fullbleed to lay it out on printed pages. Your report can combine a flowing table
with typography, summary panels, SVG charts, and page numbers.
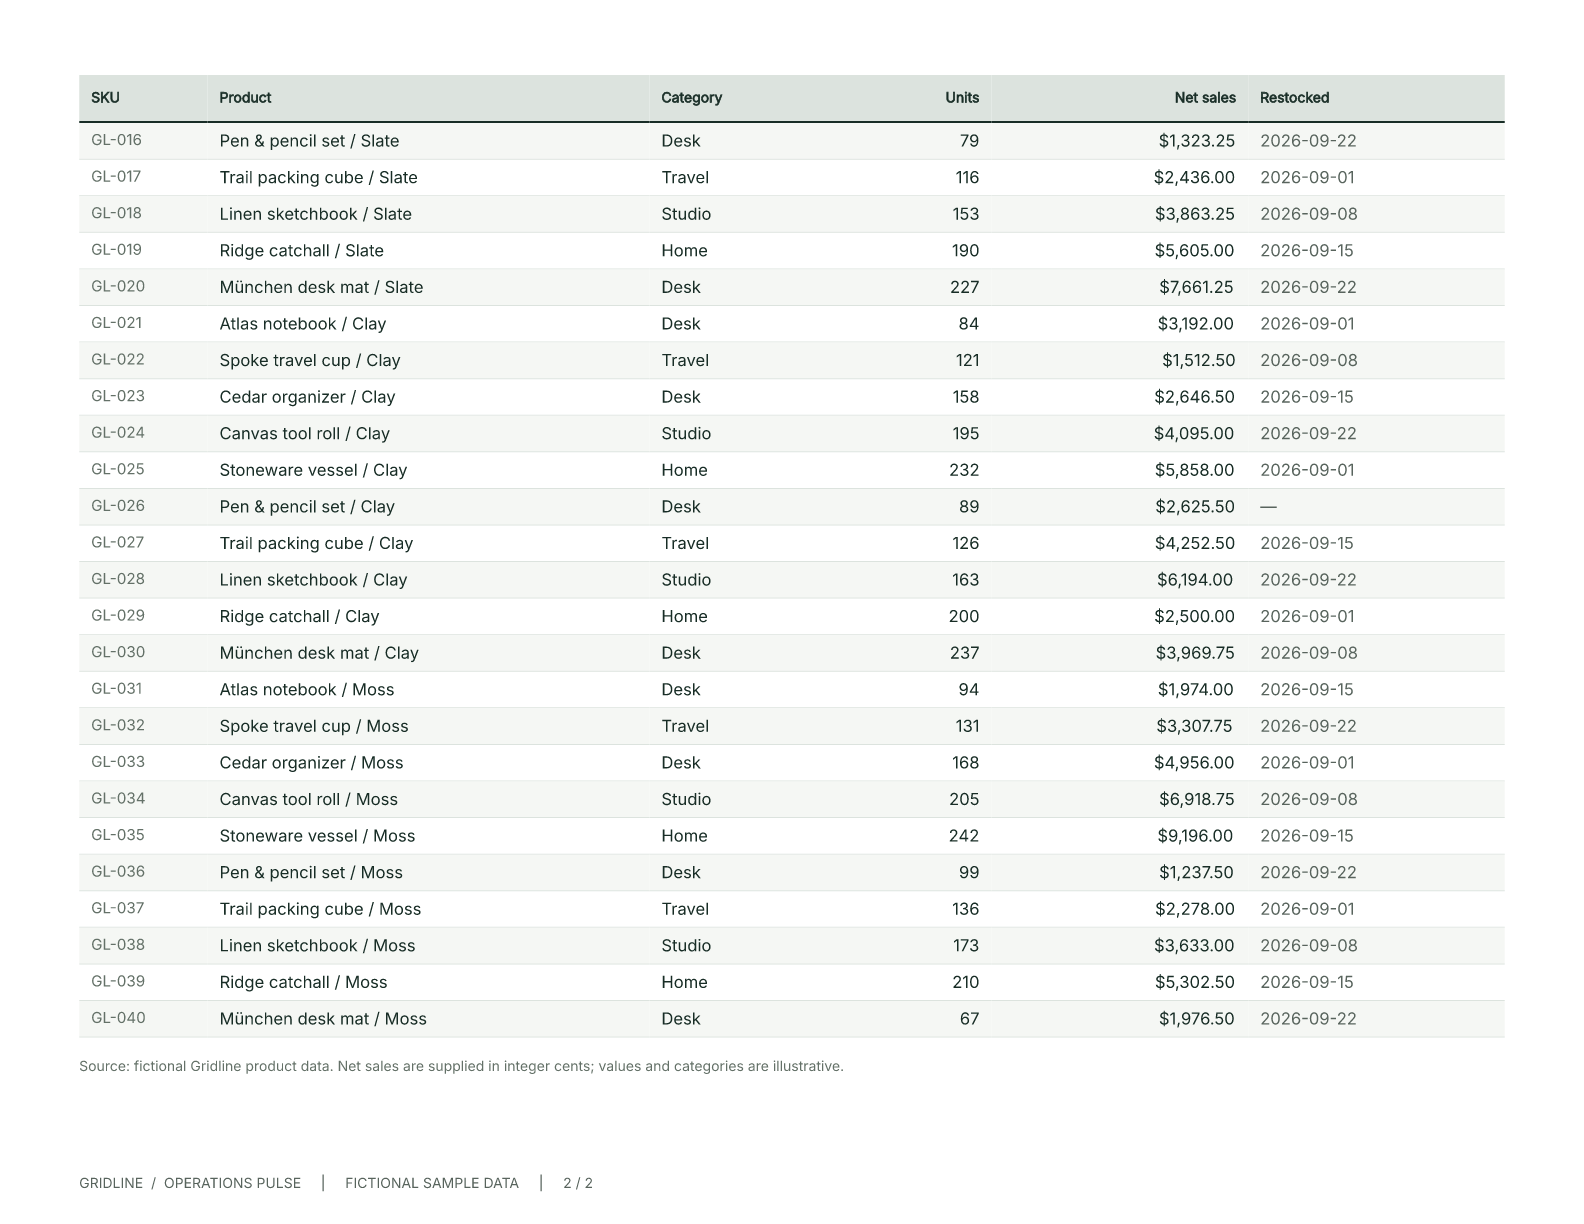
This example turns 40 product rows into a two-page landscape report. The preview comes from its actual PDF, rendered with Fullbleed 2.5.2 and pandas 3.0.6. The organization and data are fictional.
Download the two-page PDF Get the complete source
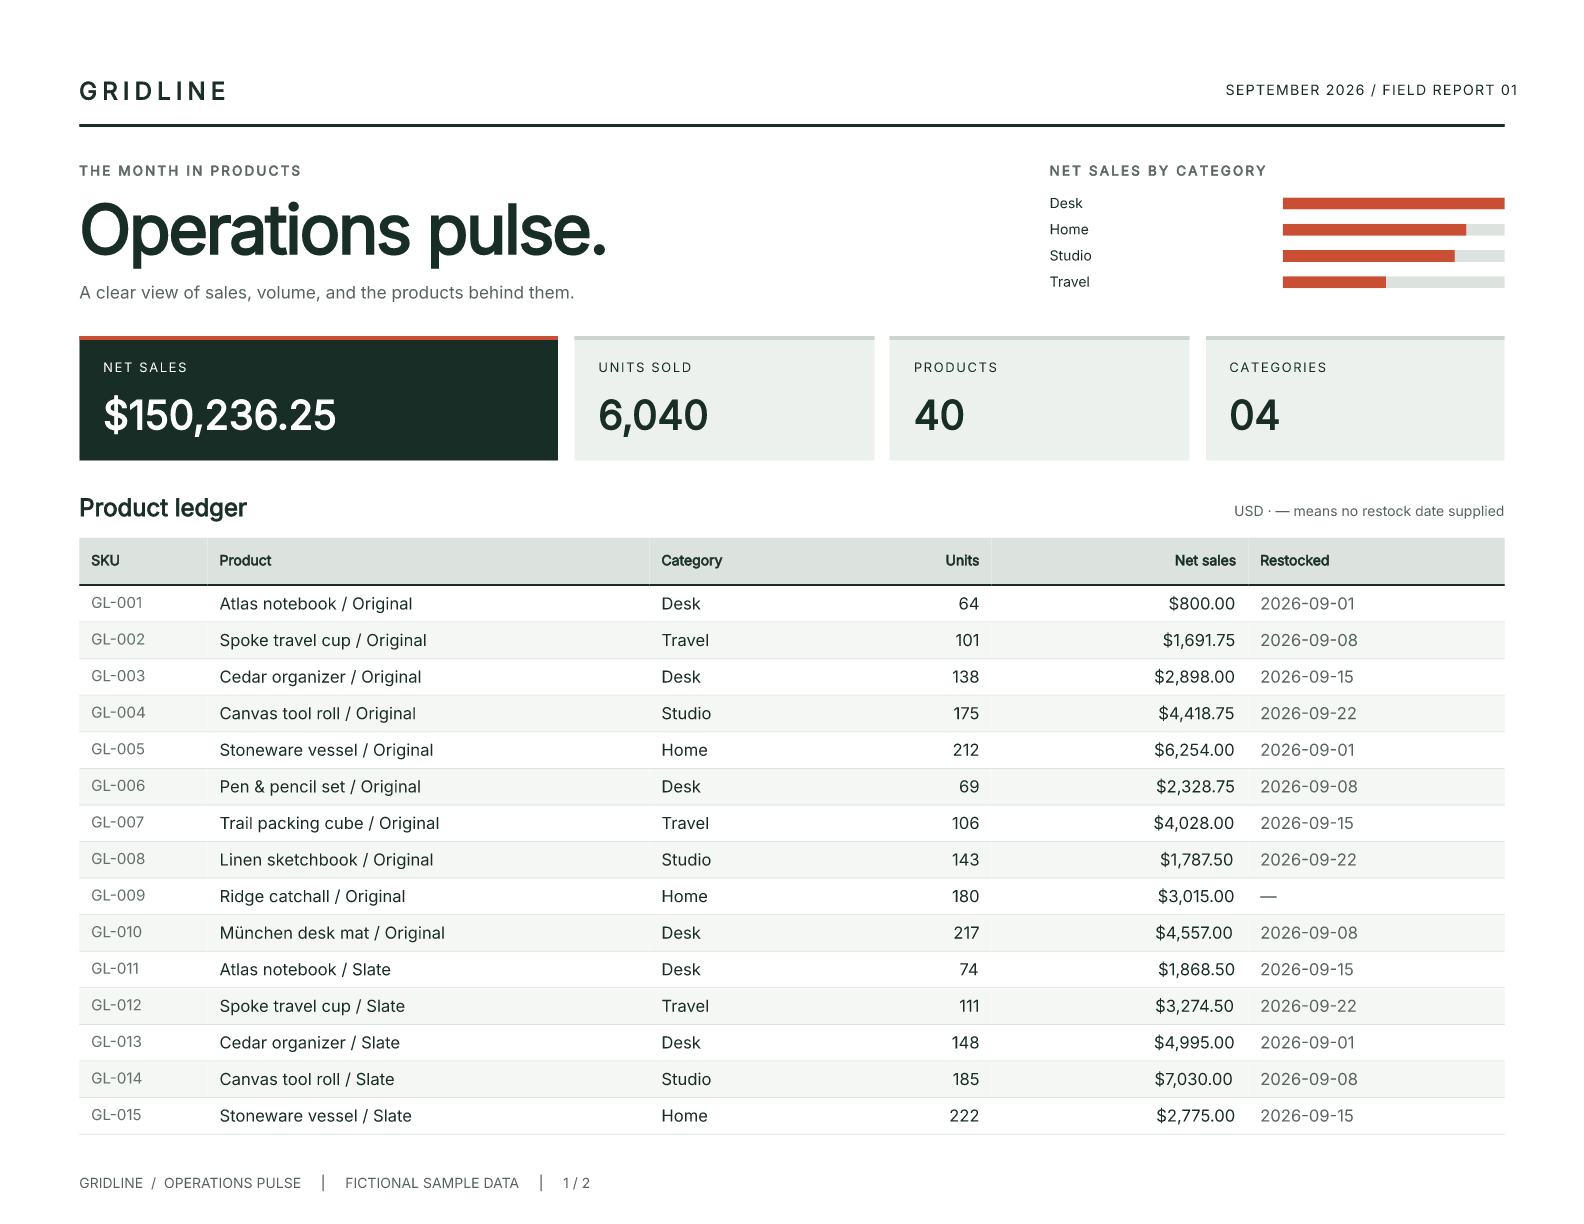
Preview page 2 · Browse the Python and CSS
Start with a small DataFrame
Use a Python 3.11 or newer virtual environment. Install the versions used here:
Save this as table_pdf.py, then run python table_pdf.py:
from importlib import resources

import fullbleed
import pandas as pd

df = pd.DataFrame({
    "Product": ["Atlas notebook", "Pen & pencil set", "München desk mat"],
    "Units": pd.Series([64, 69, pd.NA], dtype="Int64"),
})

# Make a presentation copy and normalize the different pandas NA sentinels.
display = df.astype(object).where(df.notna(), float("nan"))
table = display.to_html(
    index=False, border=0, classes="report-table", justify="left",
    escape=True, na_rep="—", max_rows=None, max_cols=None,
)
html = '<html lang="en"><body><h1>Product summary</h1>' + table + '</body></html>'
css = """
@page { size: A4; margin: 18mm; }
body { font-family: Inter; font-size: 10pt; color: #182d26; }
h1 { font-size: 26pt; }
.report-table { width: 100%; border-collapse: collapse; }
.report-table thead { display: table-header-group; }
.report-table th { background: #dce3de; text-align: left; }
.report-table th, .report-table td { padding: 8pt; border-bottom: 0.5pt solid #cbd4cd; }
.report-table tr { break-inside: avoid; }
.report-table th:last-child, .report-table td:last-child { text-align: right; }
"""
font = resources.files("fullbleed_assets").joinpath("fonts/Inter-Variable.ttf")
engine = fullbleed.PdfEngine(font_files=[str(font)])
engine.render_pdf_to_file(html, css, "table.pdf")
engine.render_finalized_pdf_image_pages_to_dir("table.pdf", "preview", 144, "table")
Open table.pdf and the PNG in preview/. Fullbleed loads Inter from its wheel,
so this script needs no system fonts, browser, or system PDF installation. Pandas
is a dependency of your data workflow; it is not a dependency of Fullbleed itself.
DataFrame.to_html()
returns an HTML table. index=False hides row labels, classes gives the table a
CSS selector, and escape=True keeps <, >, and & in your data as literal
text. The example normalizes missing values on a copy so nullable integers,
strings, floats, and dates can use the same em dash. It leaves df unchanged.
Render the complete report
Download and extract the source ZIP, then run these commands from the extracted directory:
python -m pip install -r examples/pandas_report/requirements.txt
python examples/pandas_report/report.py --out output/pandas-report
The ZIP includes report.py, report.css, the 40-row CSV, pinned requirements,
the verifier, and a README. Inter and its license come with the Fullbleed wheel.
The output directory contains the PDF, HTML/CSS, one PNG per page, and a JSON
record of the versions, page count, PDF hash, and font hash.
Use another CSV and reporting period:
python examples/pandas_report/report.py --csv products.csv --period "OCTOBER 2026" --out output/october
| Column | Expected value |
|---|---|
sku |
Unique, nonempty product identifier |
product |
Product name |
category |
Category label |
units |
Nonnegative integer count |
net_sales_cents |
Signed integer USD cents, such as 1250 for $12.50 |
last_restock |
YYYY-MM-DD date, or blank |
Only the restock date may be missing. The loader rejects missing required
columns, duplicate SKUs, invalid dates, and missing required values. Extra
columns are ignored. Change load_data() and document_html() to use a
different schema. Replace the fictional brand, source note, and footer when
using real data.
Format values before laying out the table
Keep calculation columns numeric, then create display columns for the PDF. The
complete example stores money in integer cents and formats it with Decimal;
it totals the original values before presenting them as currency strings. Dates
use YYYY-MM-DD, and a missing restock date becomes an em dash.
The table uses escape=True. Titles, reporting periods, and category labels
inserted outside the table are escaped with html.escape() as well. Apply the
same treatment when adding a customer name or another text field to the layout.
Control pagination and styling
Edit report.css to change the page size, margins, fonts, palette, and column
widths. The supplied report uses:
- A landscape Letter page and a wide, wrapping product column.
- Right-aligned units and currency, with alternating row backgrounds.
- A
theadthat repeats on each table page and rows kept together when they fit. - A summary grid and native SVG bars for positive net sales by category.
- A footer with
{page}and{pages}filled by the engine.
Negative category totals have an empty bar in this example. Use a chart with a signed axis if negative categories need visual comparison. For wider tables, choose the useful columns and set their widths deliberately. Very long labels or a row taller than a page need a different layout. Review every preview after changing data, fonts, or CSS; the CSS coverage page describes the engine's supported layout surface.
This workflow exports a DataFrame as a text table and styles it with document CSS. It does not promise a pixel-identical reproduction of an arbitrary pandas Styler or notebook display.
Check the result
Run the included verifier:
It renders the 40-row sample, an edge-case sample, and a 120-row report with wrapped names. Checks cover preserved row order, repeated column headers, correct page numbers, totals, Unicode text, missing values, negative amounts, literal markup, and identical PDF bytes from separate Python processes. Source overflow, missing-glyph, and font-substitution diagnostic gates also run.
The verification record retains versions, hashes, checks, and validation scope. The example is exercised on Windows and Linux with pandas 2.3.3 and 3.0.6 and Fullbleed 2.5.2. All nine pages of the sample, edge-case, and long-fixture PDFs were visually reviewed. These fixture checks do not establish PDF standards conformance.
For another data workflow, try JSON and CSV invoices, PDF responses from FastAPI, Flask, or Django, or compiled variable-data documents.